Best Top Power BI Dashboards Examples for 2021

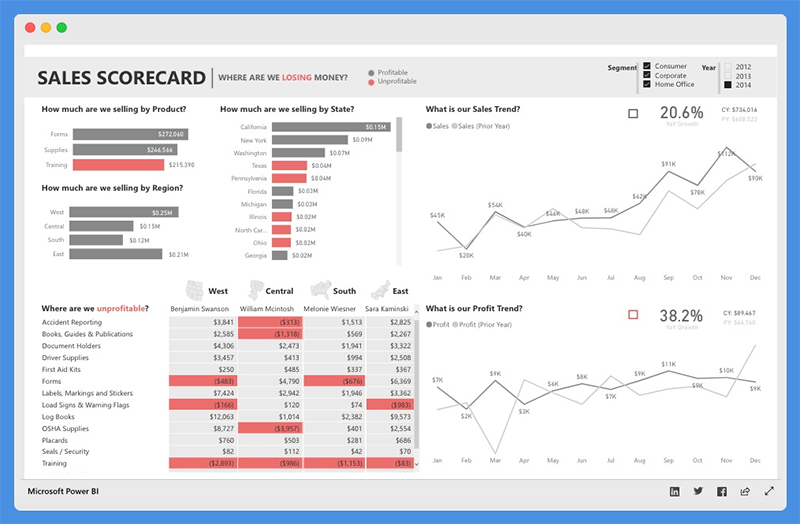
Global SuperstoreAs its name explicitly suggests, the Global Superstore Dashboard provides a deeper look at a company's sales performance.
|
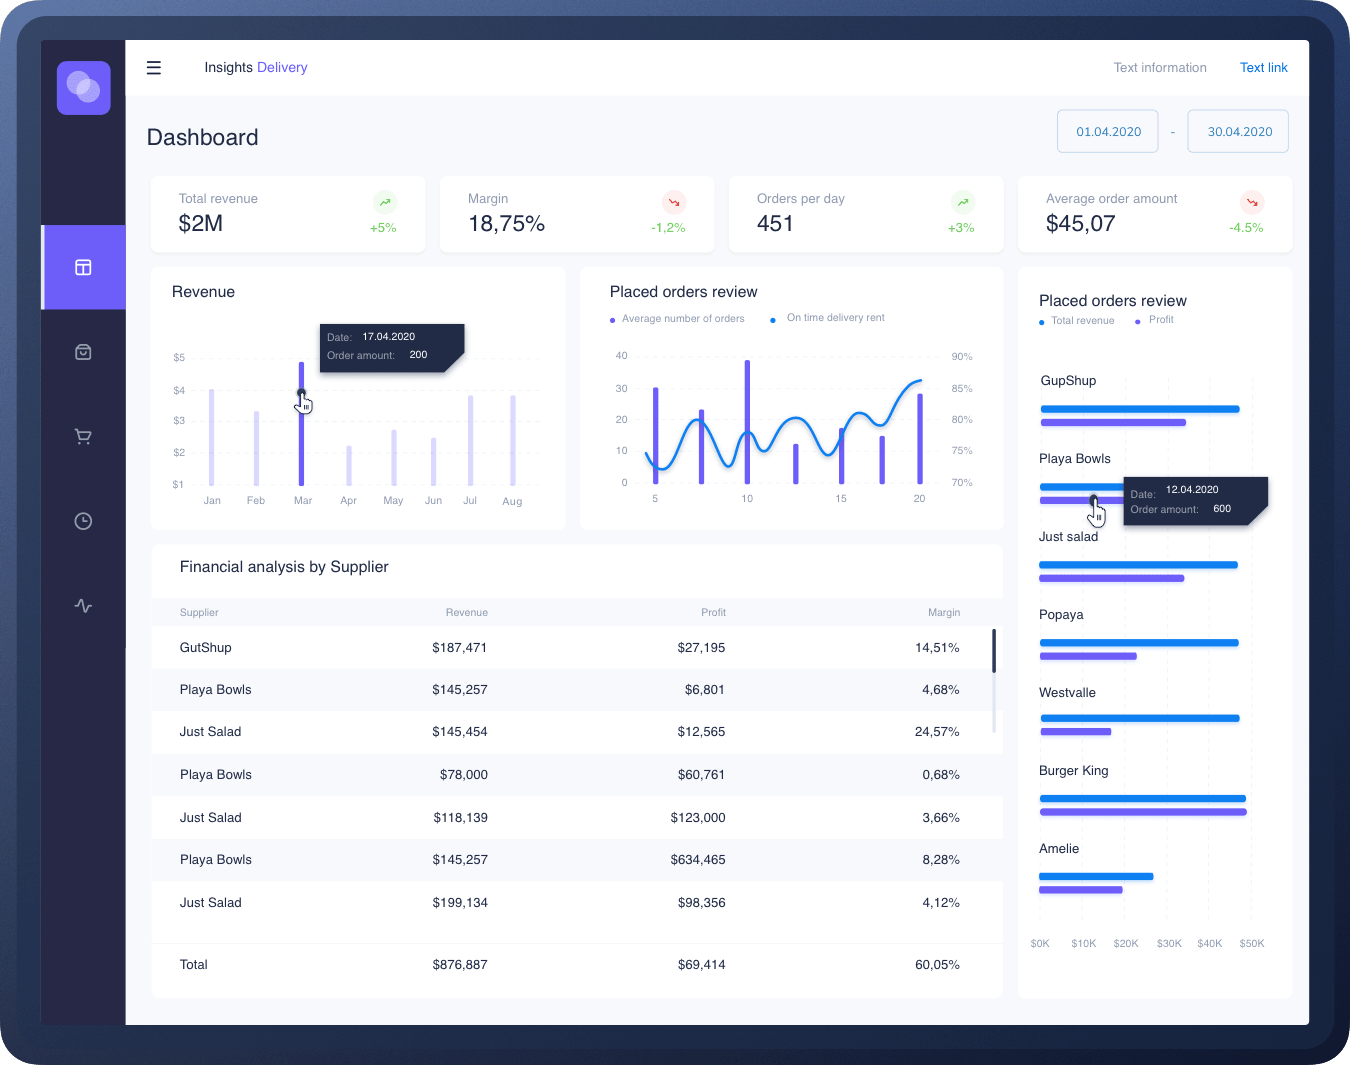
Insights DeliveryThis free Power BI dashboard template for delivery management allows processing orders on time edit.
|

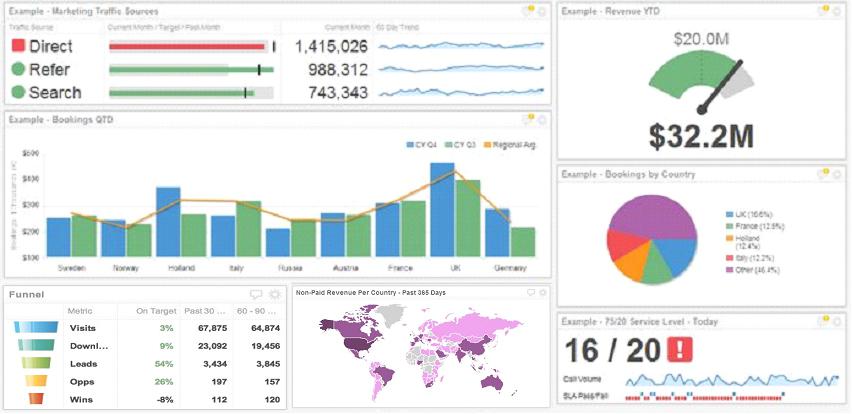
Pharma Sales Analysis
The Pharma Sales Analysis Dashboard is a tool that allows providers of veterinary products to check sales numbers for products used to treat small animals.
|