Power BI SALES Report Template
Power BI SALES Report Template
Before downloading, I recommend you to see the 4 minutes intro video, or to try the full online demo.
That's because the download of the free report template will take you more time to setup and see the results.
That's because the download of the free report template will take you more time to setup and see the results.
Hello, I am happy to present you the simplest and most effective solution for BI (business intelligence), and even the cheapest. And there is also a FREE partial version.
Want to know what's going on in your business?
Immediately, at any moment required? Alone, without asking for help? In an interactive, easy and fast way, both visually and numerically?
Want to get the big picture, and get down to the details as needed?
Want to get analytical capabilities, which still cost at least tens of thousands of dollars, at a ridiculous price?
Want to compare your main measures: sale, cost, profit, profit percent, quantity, price, counts and averages - by your main dimensions: geography hierarchy (continent, country, state and city), product hierarchy (department, category, subcategory and product), stores, customers, employees and orders?
Want to drill down through periods from years, quarters, months, weeks to days?
You came to the right place!
Let me introduce to you PBiQTS, a Power BI Report Template for Sales. PBiQTS Power BI Sales Report Template binds 100 interactive reports for analyzing sales of any business, even of an international organization.
PBiQTS Power BI Sales Report Template is designed to be the main analysis tool for business decision makers.
First a few words about the platform I used: Power BI (Intro 2).
Power Bi is a complete and innovative environment from Microsoft.
It makes it possible, easily and quickly, to create interactive reports and share them on the local network or on the internet.
It connects to almost any data source, processes the data and presents it in a visually convenient way.
You can work on any device (computer, company server, secure Microsoft server and even a smartphone).
The greatest strengths of the PBI platform are: it's ease of use and develop, the capacity to use from any device and over the internet, the free version, the security, the speed of in-memory calculations, the beauty and the usability.
This allows business data to be explored quickly and easily, at the level of complicated systems,
which cost tens of thousands of dollars, and only large companies can afford.
And all these benefits are for free, unless you have special requirements of secure sharing.
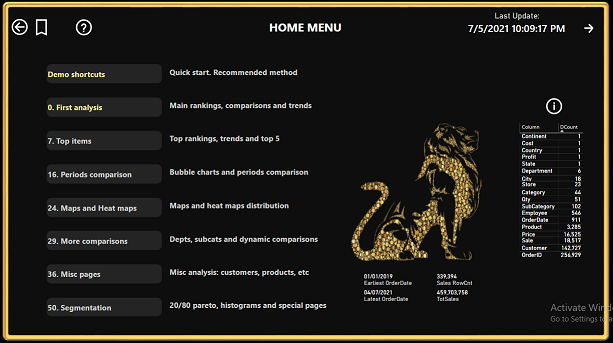
Power BI Sales Template - Main menu
|
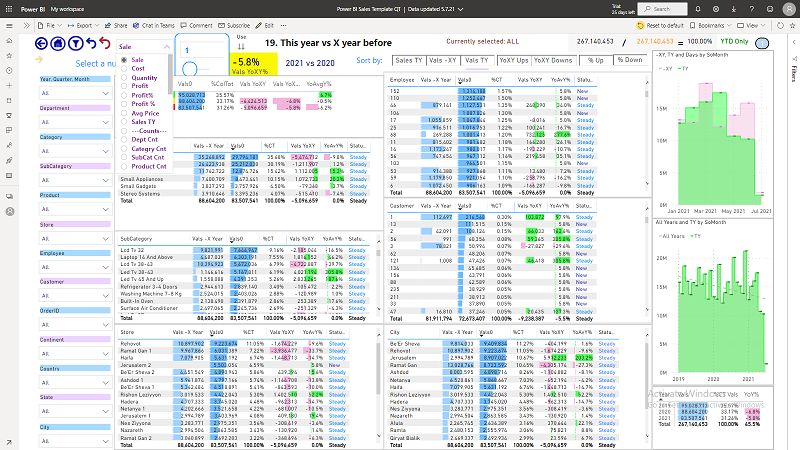
Power BI Sales Template - Page report 19
|
If you have a Power BI specialist under your orders, you are in luck. And if you do not have, you have me:
I've built PBiQTS, a pbi report template of 100 sales-focused interactive reports that will make it very easy for you to research your data,
understand the problems and opportunities, and make the right decisions for a significant improvement in profitability.
A profit improvement of at least one percent is guaranteed in a few hours.
And in a chaotic period like today, you will likely experience much more profit improvement.
Plus, the more you understand your business, the less you will make costly mistakes.
So, I created PBiQTS, a Power BI sales report template, that will suit you in the top 80 percent of your needs.
This report template easily connects to your sales data, and allows you to understand them from the general to the specific, and to separate the wheat from the chaff.
In addition, as an open and understandable report template, you can completely customize it to yourself:
For example, by renaming, and by adding (or deleting) formulas, pages, graphs, tables and even fields. And of course design changes.
And you can also learn methods, techniques and formulas from it.
My recommended starting method, for understanding the data in depth, is of 6 rounds of 15 questions:
Round 1: Look at the summaries of the whole business.
Round 2: Focus on the main department. Then on the second and sometimes also on the third.
Round 3: Focus on the main category. Then on the second and sometimes also on the third.
Round 4: Focus on the store, or the salesman, or the main customer. Then on the second and sometimes also on the third.
Round 5: Gradually go "down" from a resolution of years to quarters, months, weeks and sometimes up to days.
Round 6: After the sales-focused rounds, focus on profit, then profit percentage, average price, quantity, cost, etc.
In each round, those 15 questions are asked:
Question 1: What are the main parts of the business? The most profitables?
Question 2: What are the multi-year trends?
Question 3: What are the fluctuations throughout the months of the year?
Question 4: Who are the exceptions, for better or worse?
Question 5: What is the ranking of the top five over time?
Question 6: What are the differences of this year (to date) compared to the first year in the data?
Question 7: What are the differences of this year (to date) compared to last year (or a year before if the corona pandemic disrupted last year)?
Question 8: What are the differences of this period (any number of days to date) compared to the previous period?
Question 9: What does it look like on a map?
Question 10: What does the scattering on a matrix (heat map) look like?
Question 11: What is the relationship between the main department and the second?
Question 12: What is the ratio between product groups?
Question 13: Does the 20/80% rule apply? How can you streamline your business?
Question 14: What is the potential of each store compared to the average?
Question 15: What does the division into deciles teach?
The first round takes hours, but then it gets fast.
You will very quickly move on to your own unique method. And then to free-style research.
Enough words. If one image is worth 1000 words, a video is probably worth 100 images.
And live online experience, with the full template, with real-world data, is probably worth 10 videos!
How many words have I saved now? About a million words :-)
Just try it now online, and you'll understand how great it is for you.
Make your data rock!


* Free and Premium editions available. The free version contains 35 pages. The premium version contains 112 pages. You can work with the free version, and postpone the purchase of the premium version until you are sure it is worth it. If you need assistance, please contact me.
180 days money-back garantee (Paypal Buyer Protection). Phone support included. Whatsapp support included.
180 days money-back garantee (Paypal Buyer Protection). Phone support included. Whatsapp support included.
I call it a Sales Report Template, but it allows you to compare ALL the main measures: sale, cost, profit, profit percent, quantity, price, counts and averages - by all the main dimensions: geography hierarchy (continent, country, state and city), product hierarchy (department, category, subcategory and product), stores, customers, employees and orders - through any periods from years, quarters, months, weeks to days.
PBiQTS Pbi PowerBI Power BI Sales report template works with free Power BI. Power BI have hundreds of connectors. Among them, ODBC/OLEDB drivers exists for most DBMSs, including Oracle, PostgreSQL, MySQL, Microsoft SQL Server, Sybase ASE, SAP HANA, DB2, MS Access and Excel, and Many more database platforms:
docs.microsoft.com/en-us/power-bi/connect-data/power-bi-data-sources
docs.microsoft.com/en-us/power-bi/connect-data/desktop-data-sources
docs.microsoft.com/en-us/power-bi/connect-data/power-bi-data-sources
docs.microsoft.com/en-us/power-bi/connect-data/desktop-data-sources